Beauty in Genomics
A collection of assembly graphs from my genomics research, revealing unexpected shapes and patterns in bacterial and phage metagenomes. These figures highlight the visual beauty and complexity of genomic data. Thanks to Bandage for making these assembly graph visualisations possible.

Smiley simPhage
This is the assembly graph of a simulated metagenome containing the phages:
- Enterobacteria phage P22 (AB426868)
- Enterobacteria phage T7 (NC_001604)
- Staphylococcus phage SAP13 TA-2022 (ON911718)
- Staphylococcus phage SAP2 TA-2022 (ON911715)
This dataset was used to benchmark Phables.
DOI: 10.1093/bioinformatics/btad586

simHC+ metaSPAdes
This is the assembly graph of a simulated metagenome with 100 bacterial species. This dataset was simulated based on the original proportions provided in the MaxBin paper.
This dataset was used to benchmark MetaCoAG.
DOI: 10.1007/978-3-031-04749-7_5

ESC metaSPAdes
This is the assembly graph of a simulated metagenome containing the following three bacteria and their corresponding proportions. These were the three most abundant species from the run SRR492184 of the Sharon dataset (NCBI accession number SRA052203).
- Enterococcus faecalis - 70.8%
- Staphylococcus aureus - 18.9%
- Cutibacterium avidum - 3.4%
This dataset was used to benchmark GraphBin.
DOI: 10.1093/bioinformatics/btaa180
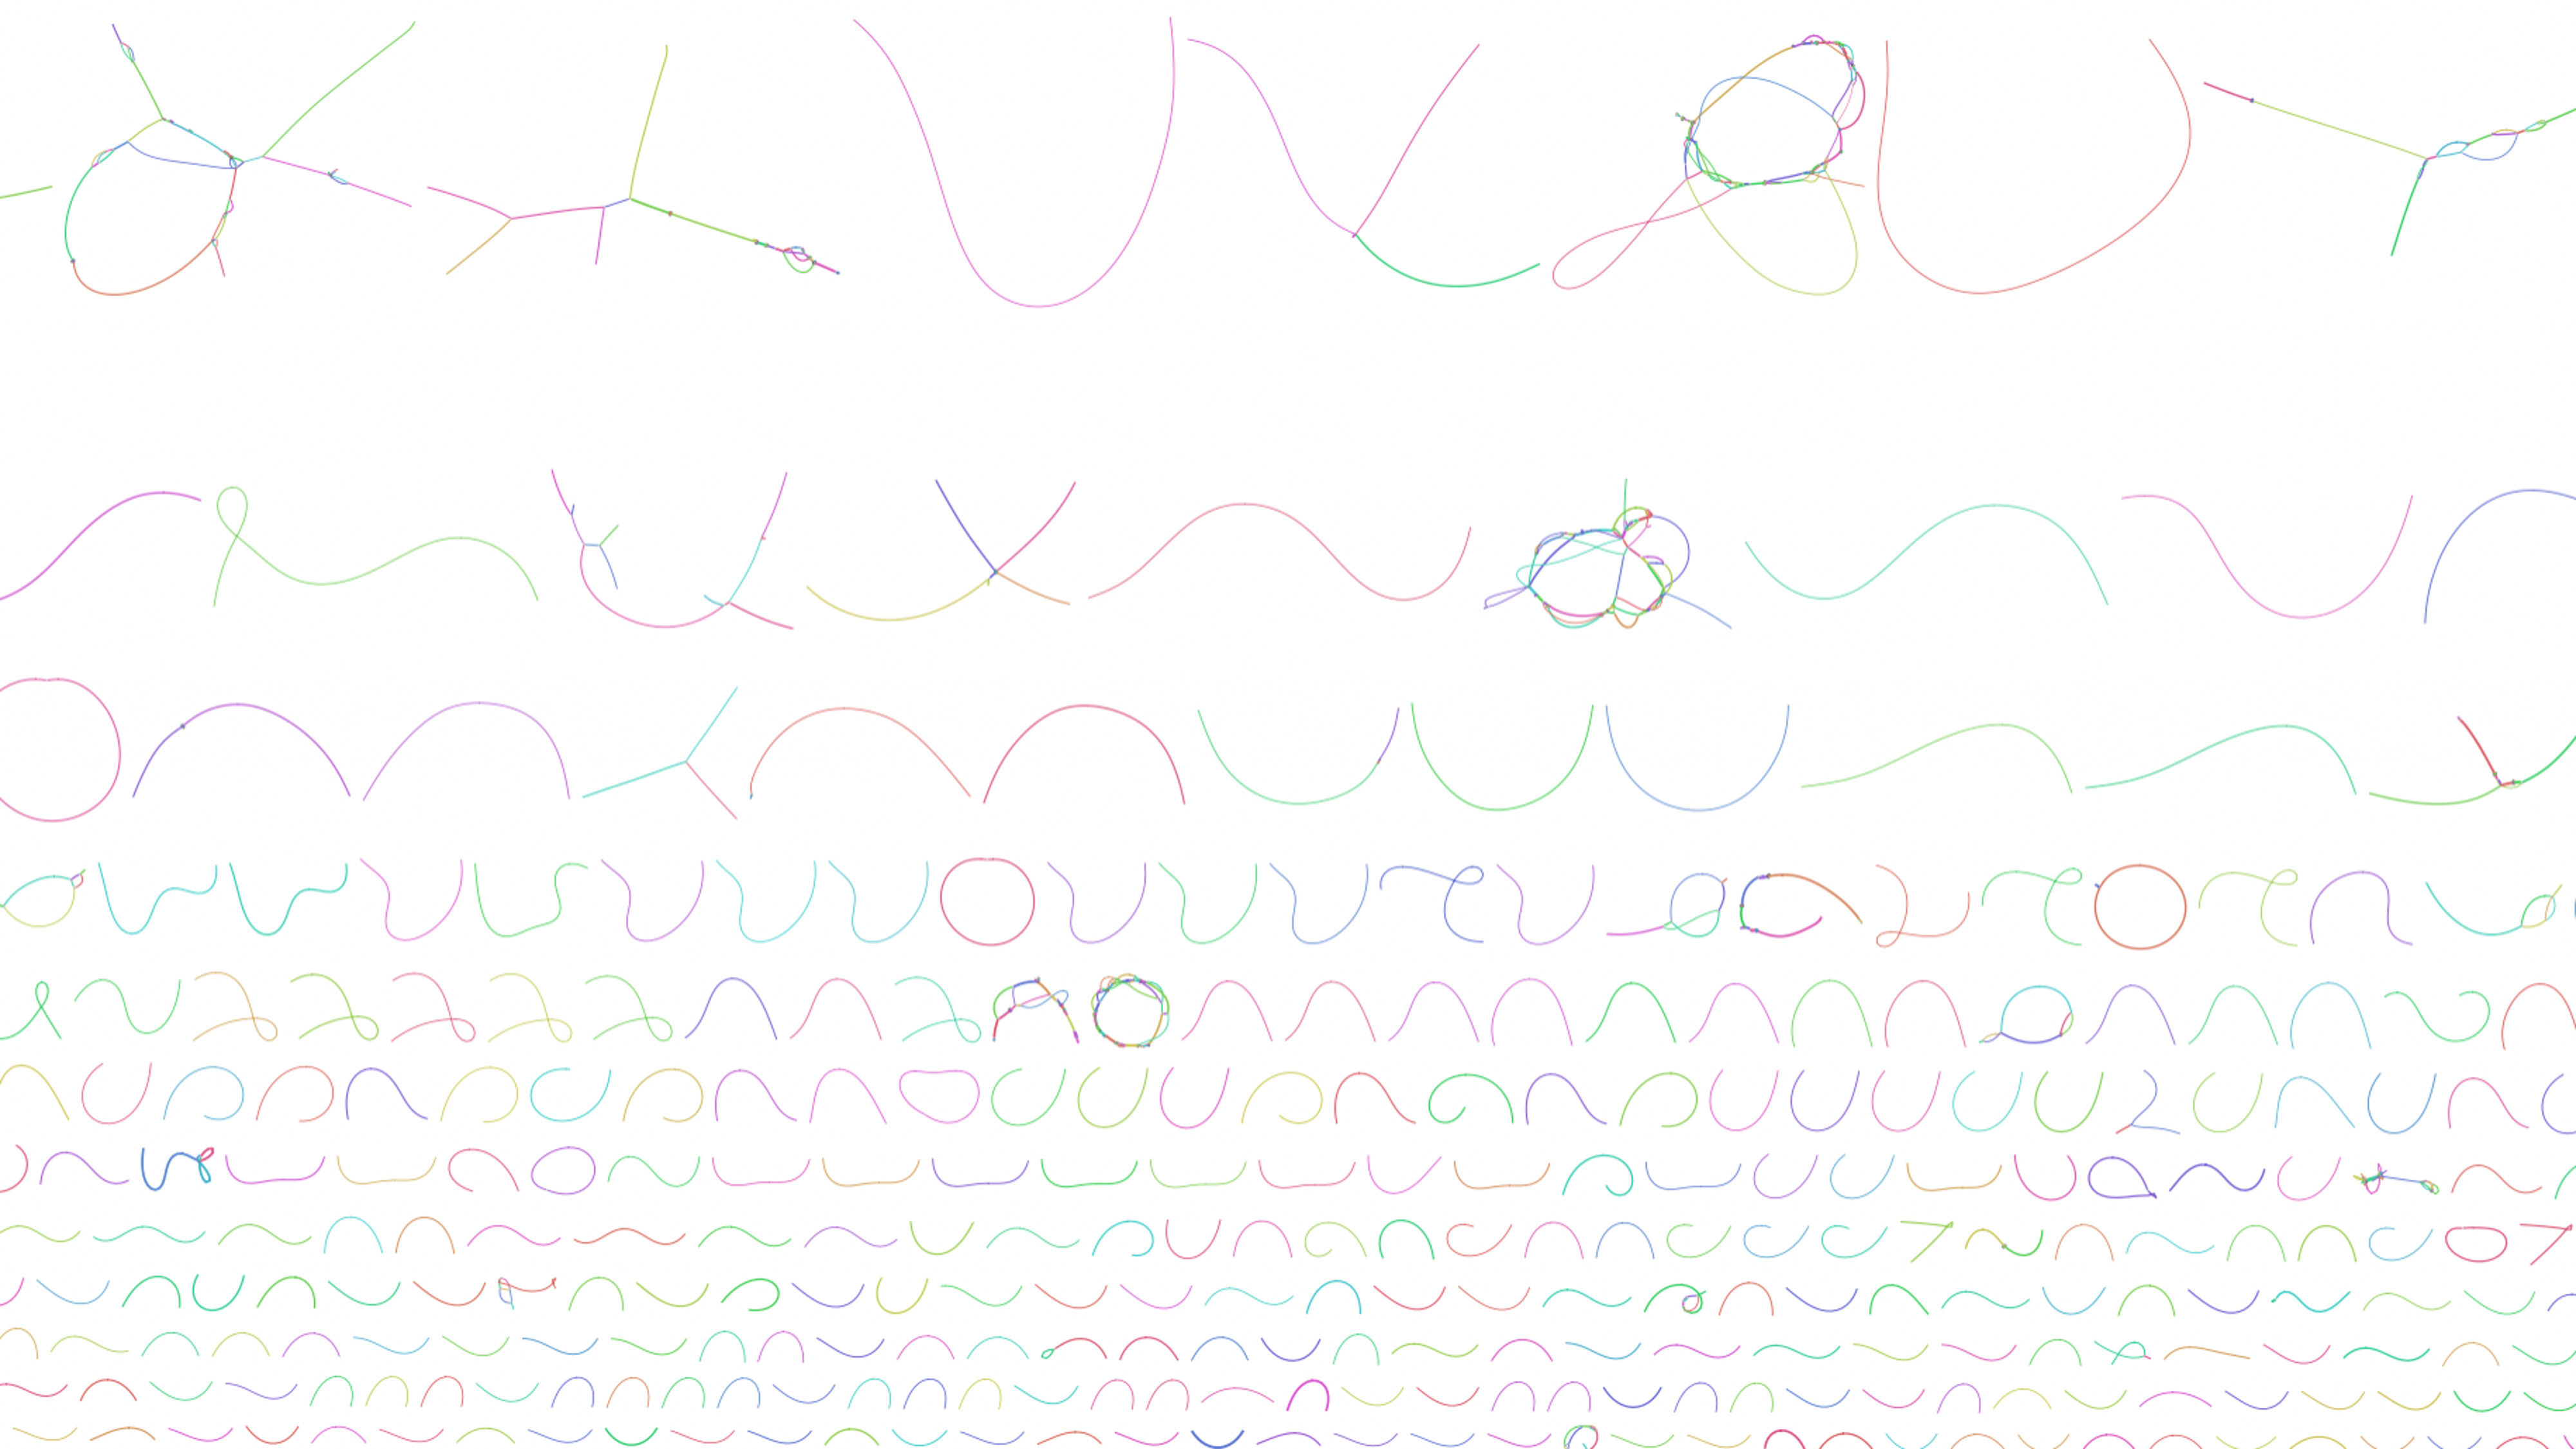
IBD virome assembly graph wallpaper
This is the assembly graph of a co-assembly of metaviromic samples from the study by Norman et al, 2015. The data can be found at NCBI BioProject number PRJEB7772. I often use this as the background for my talk slides.
This dataset was used to benchmark Phables.
DOI: 10.1093/bioinformatics/btad586